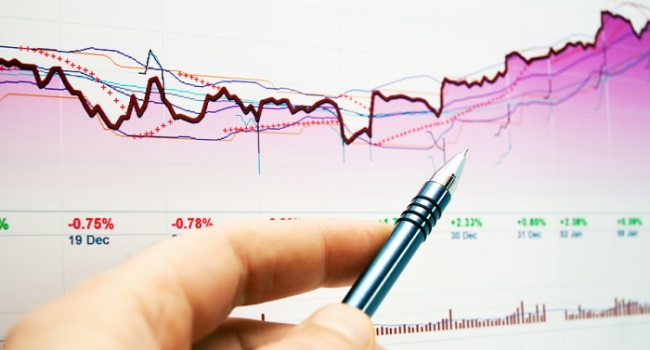
If you have ever seen a trader’s computer screen and the variety of charts they use then they are using technical analysis to make their decisions on whether to buy or sell a stock.
If used correctly, technical analysis has been proven to be an effective tool for traders and is one of the most significant tools available for forecasting a stock’s price movement.
So What is Technical Analysis?
Technical Analysis is the analysis of a stock’s history to help determine the possible future behavior by studying charts.
Like weather forecasting, technical analysis does not result in absolute predictions about the future. But, technical analysis is a very helpful indicator to aid traders in making buy or sell decisions on a stock.
Technical analysis is used to help traders identify patterns that can help suggest future activity of a stock’s price in an attempt to discover whether it will go up or down in the near future.
Here’s a basic example on how technical analysis is used:
A trader may look at a stock and notice a particular pattern in the price. And because patterns tend to repeat, the trader looks for stocks that form a particular pattern.
Say for example the trader spots a pattern in the stock of AAPL and it is forming a pattern called a Cup and Handle (a popular chart pattern)
The trader then would mostly likely execute a trade to buy the stock because a Cup and Handle pattern is a bullish uptrend signal that the stock will most likely move higher.
The above is just an example of a common technical analysis pattern. There are many more out there that I will get into later.
WHO USES TECHNICAL ANALYSIS
Technical Analysis is a very important tool used mostly by traders.
It is used by all types of traders that trade stocks, forex, commodities, futures or any other tradable instrument where the price is influenced by the forces of supply and demand.
A person who uses technical analysis is often referred to as a chartist or technician, especially those that analyze stocks professionally based on technical analysis.
ADVANTAGES OF TECHNICAL ANALYSIS
Technical analysis can become a self fulfilling prophecy. When many traders, using similar tools and following the same concepts, shift together the supply and demand, this can lead to the prices moving in the predicted direction.
It requires much less data than fundamental analysis. From price and volume, a technical trader can obtain all the information he needed.
As it is focused on identifying trend reversal, the question of timing to enter a trade is easier to address with technical analysis.
DRAWBACKS OF TECHNICAL ANALYSIS
Some traders often experience “paralysis by analysis” when it comes to technical analysis. This occurs when a trader over-analyzes (or over-thinking) and becomes so lost in the process of examining and evaluating various points of data that he or she is unable to make a decision with it.
Technical analysis can be as easy or as hard as you make it.
Technical analysis is not always accurate and traders need to apply the proper risk management. Some stocks have their own characteristics. So what interpretation holds true for one stock, may not work with another. Although most principles of Technical Analysis are universal, and although patterns and indicators have pre-given rules to follow, they may not always work all the time.
TECHNICAL ANALYSIS AND FUNDAMENTAL ANALYSIS
The main two methods used to analyze stocks and make buy or sell decisions fall into two broad categories: fundamental analysis and technical analysis.
Lets take a quick look at the two to see how they differ.
Fundamental analysis involves analyzing the fundamentals of a company in order to estimate its value. For example it looks at a company’s assets, profits, and the business trends of a company and derives an estimate of fair value for the stock.
Technical analysis takes a completely different approach; it doesn’t care at all about the “value” of a company. It relies solely on what the charts are telling the trader.
Technical analysis, instead, seeks to forecast future prices of a stock by analyzing past trading action.
Unlike fundamental analysts, technical analysts don’t care whether a stock is undervalued. Technical analysis advantage over fundamental analysis is that traders don’t form an attachment to the company as many investors often do when they hold a stock for a long time.
TECHNICAL ANALYSIS INDICATORS
Technical Analysis uses a variety of indicators, including the RSI, MACD, moving averages, and so on.
Just as there are many investment styles on the fundamental side, there are also many different types of technical traders. Some rely on chart patterns, others use technical indicators and oscillators, and most use some combination of the two.
More on Technical Analysis Indicators will be covered in an upcoming lesson.
BOTTOM LINE ON TECHNICAL ANALYSIS
Despite all the “bells and whistles” that comes with technical analysis, it really is just the study of supply and demand in a particular stock in an attempt to determine what direction, or trend, will continue in the future.
Technical Analysis can be as easy or as hard as you make it. If you understand the benefits and limitations of technical analysis, it can give you a new set of tools or skills that will enable you to be a better trader.


