Chart patterns are unique formations on a stock chart that creates a trading signal, to help predict a stock’s price movement.
These chart patterns, if understand correctly help give meaningful buy or sell signals for traders.
Chart patterns play a big role in technical analysis. When data is plotted there is usually a pattern which naturally occurs and repeats over a period.
Chart patterns help identify current trends and trend reversals and to trigger buy and sell signals.
Chart patterns can be classified as continuous patterns or reversal patterns.
- Continuous chart patterns A continuous chart pattern signals the stock is likely to continue its current trend. Common continuous chart patterns are ascending triangle, flags, and pennants.
- Reversal chart patterns A reversal chart pattern signals the current trend is likely to reverse. Common reversal chart patterns are head and shoulders, round bottom, double top, double bottom, triple top, triple bottom etc.
Below are some examples of some of the most well-known chart patterns.
Head and shoulders
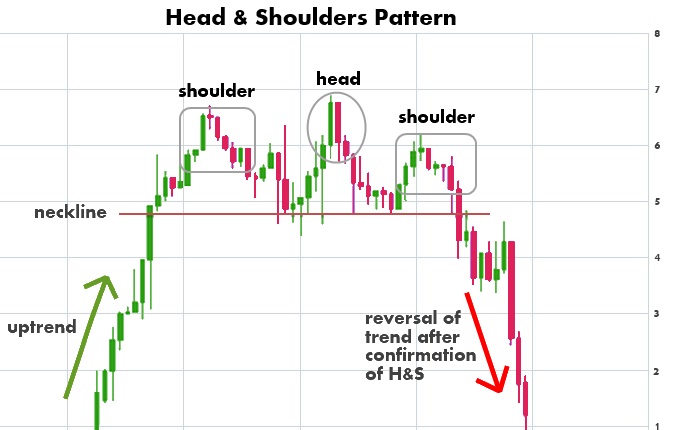

A head and shoulders is a reversal pattern that, when formed, signals the stock is likely to move against the previous trend.
This type of pattern is basically formed by a peak (shoulder), followed by a higher peak (head), and then by another lower peak (second shoulder).
A “neckline” is drawn by connecting the lowest points of the two troughs. The neckline is a level of support or resistance and the pattern is confirmed when the neckline is broken, after the formation of the second shoulder.
A head and shoulders can also be formed in the opposite direction. This type of pattern is know as an inverse head and shoulders or a head and shoulders bottom. This signals that a stocks’s price is set to rise and usually forms during a downward trend.
Read more on head and shoulders chart patterns
Cup and Handle

The cup and handle is considered a bullish continuation pattern and is formed within uptrends. It is named for its appearance which resembles a cup and handle.
This pattern is the result of a consolidation period in a stock, with the round cup shape followed by narrow price action which forms the appearance of a handle.
The technical buy point is when the stock breaks above the handle area to the upside.
Double Top and Bottom


Double top and double bottom chart patterns are also well-know patterns that often signal a trend reversal.
These patterns are formed after a sustained uptrend or downtrend and signal to a trader that the trend is about to reverse. The pattern is created when a price movement tests support or resistance levels twice and is unable to break through and ultimately reverses direction.
Double Top
The double top formation pattern looks like the letter “M”. This chart pattern is formed after a period of an uptrend, and the pattern is formed by two consecutive peaks that are almost equal to each other, with a “valley” in between.
After two unsuccessful attempts of the stock moving higher, the trend reverses and the price heads lower.
Double Bottom
The double bottom formation looks like the letter “W” and the pattern is basically the opposite of the double top pattern.
This chart pattern is formed after a period of a downtrend, and is formed by two consecutive valleys that are approximately equal to each other, with a peak in between.
The price movement of the stock went lower twice, but found support each time. After the second bounce off of the support, the trend reverses and the price heads higher.
Triple Top and Bottom


A triple top and a triple bottom are both reversal patterns. This pattern is similar to doubles, except that a stock tries to move past a key level of support or resistance three times and is unable to move through and then reverses direction.
Triple top
A triple top pattern suggests a reversal of an uptrend. This bearish reversal pattern is formed when a stock is trending upward tests a similar level of resistance three times without breaking through.
Each time the stock tests the resistance level, it falls to a similar area of support. After the third fall to the support level, the pattern is complete when the stock falls through the support. The trend is then expected to reverse and move in a downward trend.
Triple bottom
A triple bottom chart pattern is the opposite of the triple top. The triple bottom is formed after a period of a downtrend, and is formed after the price movement of the stock went lower three times, but found support each time around the same level.
After the third bounce off of the support level and then a breakthrough the resistance level, the trend reverses and the stock moves higher.
Triangles


Triangles are continuation patterns, which means it signals that the existing trend will continue.
Triangles are one of the most well-known chart patterns used in technical analysis because they appear a lot on charts, however, they are the least reliable. Still, we need to add them to our analysis tools but be cautious about them because they happen a lot.
There are three different types of triangles: symmetrical triangles, ascending triangles, and descending triangles.
Symmetrical Triangles
A Symmetrical Triangle pattern is often considered a neutral chart pattern and is characterized as an area of indecision. A future direction of the stock is in question where it has the potential to break either to the upside or downside and once it breaks to one side it is a confirmation of a trend in that direction.
However, research has shown that symmetrical triangles resolve themselves in the direction of the trend. In my opinion, symmetrical triangles are great patterns to use and should be traded as continuation patterns.
The symmetrical triangle pattern contains at least two lower highs and two higher lows. Two trendlines are drawn that converge together and a symmetrical triangle takes shape.
Ascending Triangle
The ascending triangle is a bullish formation that usually forms during an uptrend. In most cases, the formation is a continuation pattern in which traders look for an upside breakout.
Below is an Ascending Triangle:
In an ascending triangle, the upper trendline is flat and becomes a level of resistance, while the bottom trendline is upward sloping and becomes a level of support.
Descending Triangle
The descending triangle is basically the opposite of an ascending triangle. It is a bearish formation that usually forms during a downtrend. In most cases, the formation is a continuation pattern in which a downtrend is expected to continue.
Below is a Descending Triangle:
In a descending triangle, the lower trendline is flat and becomes a level of support, while the top trendline is downward sloping and becomes a level of resistance.
Flag and Pennant


The flag and pennant patterns are two continuation patterns that are similar to each other, differing only in their shape during the pattern’s consolidation period. A flag pattern forms a rectangular shape, while the pennant looks more like a triangle.
Both the flag and pennant patterns contain a “flagpole” which is represented by the sharp move upwards or downwards, depending on the trend.
After the big move, flags and pennants represent brief consolidation period before a continuation of the trend in which occurred.
Flag
Flags are considered as continuation patterns and can be found in both an uptrend and a downtrend.
A flag chart pattern is formed when a steep rise (or fall) is followed first by trading in a narrow price range and then finalized with a second steep rise (or fall).
Below is an example of a bullish flag:
In the example above you can see the flag pattern is formed when the first steep rise creates what is known as the “flag pole”. It is then followed by the stock trading in a narrow price range which creates a “flag”. The stock then breaks out of that narrow trading range and moves higher.
Pennants
Pennants are similar to flags and are considered as continuation patterns, and can be found when a stock is both an uptrend and a downtrend.
A pennant chart pattern contains a similar “flag pole” as the flag pattern, just the consolidation period forms a different shape.
A pennant chart pattern is formed when a steep rise (or fall) is followed by the stock consolidating and trading in a narrow price range. During this narrow trading range it takes the shape of a symmetrical triangle.
After the stock breaks out of that narrow trading range, the previous trend continues.
Below is an example of a bullish pennant chart pattern.
Wedge pattern


Similar to triangles, a wedge pattern forms a narrow trading range and signals a pause in the current trend. Wedge pattern can act as both continuation or reversal of trend after the formation of a wedge.
There are two main wedge patterns: the falling wedge and the rising wedge.
Rising Wedge
Rising wedge patterns are typically a bearish signal and found at the ends of uptrends as well as during downtrends. In either case, a downside break from a rising wedge pattern is a technical sell signal or short sell signal.
If the rising wedge forms after an uptrend, it’s usually a bearish reversal pattern.
On the other hand, if it forms during a downtrend, it could signal a continuation of the down move.
A rising wedge is formed when price consolidates between upward sloping support and resistance lines.
Falling Wedge
The falling wedge is typically a bullish signal and can form in uptrends as well as during downtrends.
In a downtrend, a falling wedge typically indicates a trend reversal and that an uptrend would come next.
In a uptrend it is a continuation signal, implying that the upward price action would resume.